
Back to Storytelling with Charts
We have already discussed some basic principles of Data Storytelling. We understand the right Compares. We also select the correct chart based on keywords for your messaging. I have also introduced you to the SCR framework.
Now is the time to put into action everything we have learned (basic concepts).
Let’s examine the following example from a fictional company.
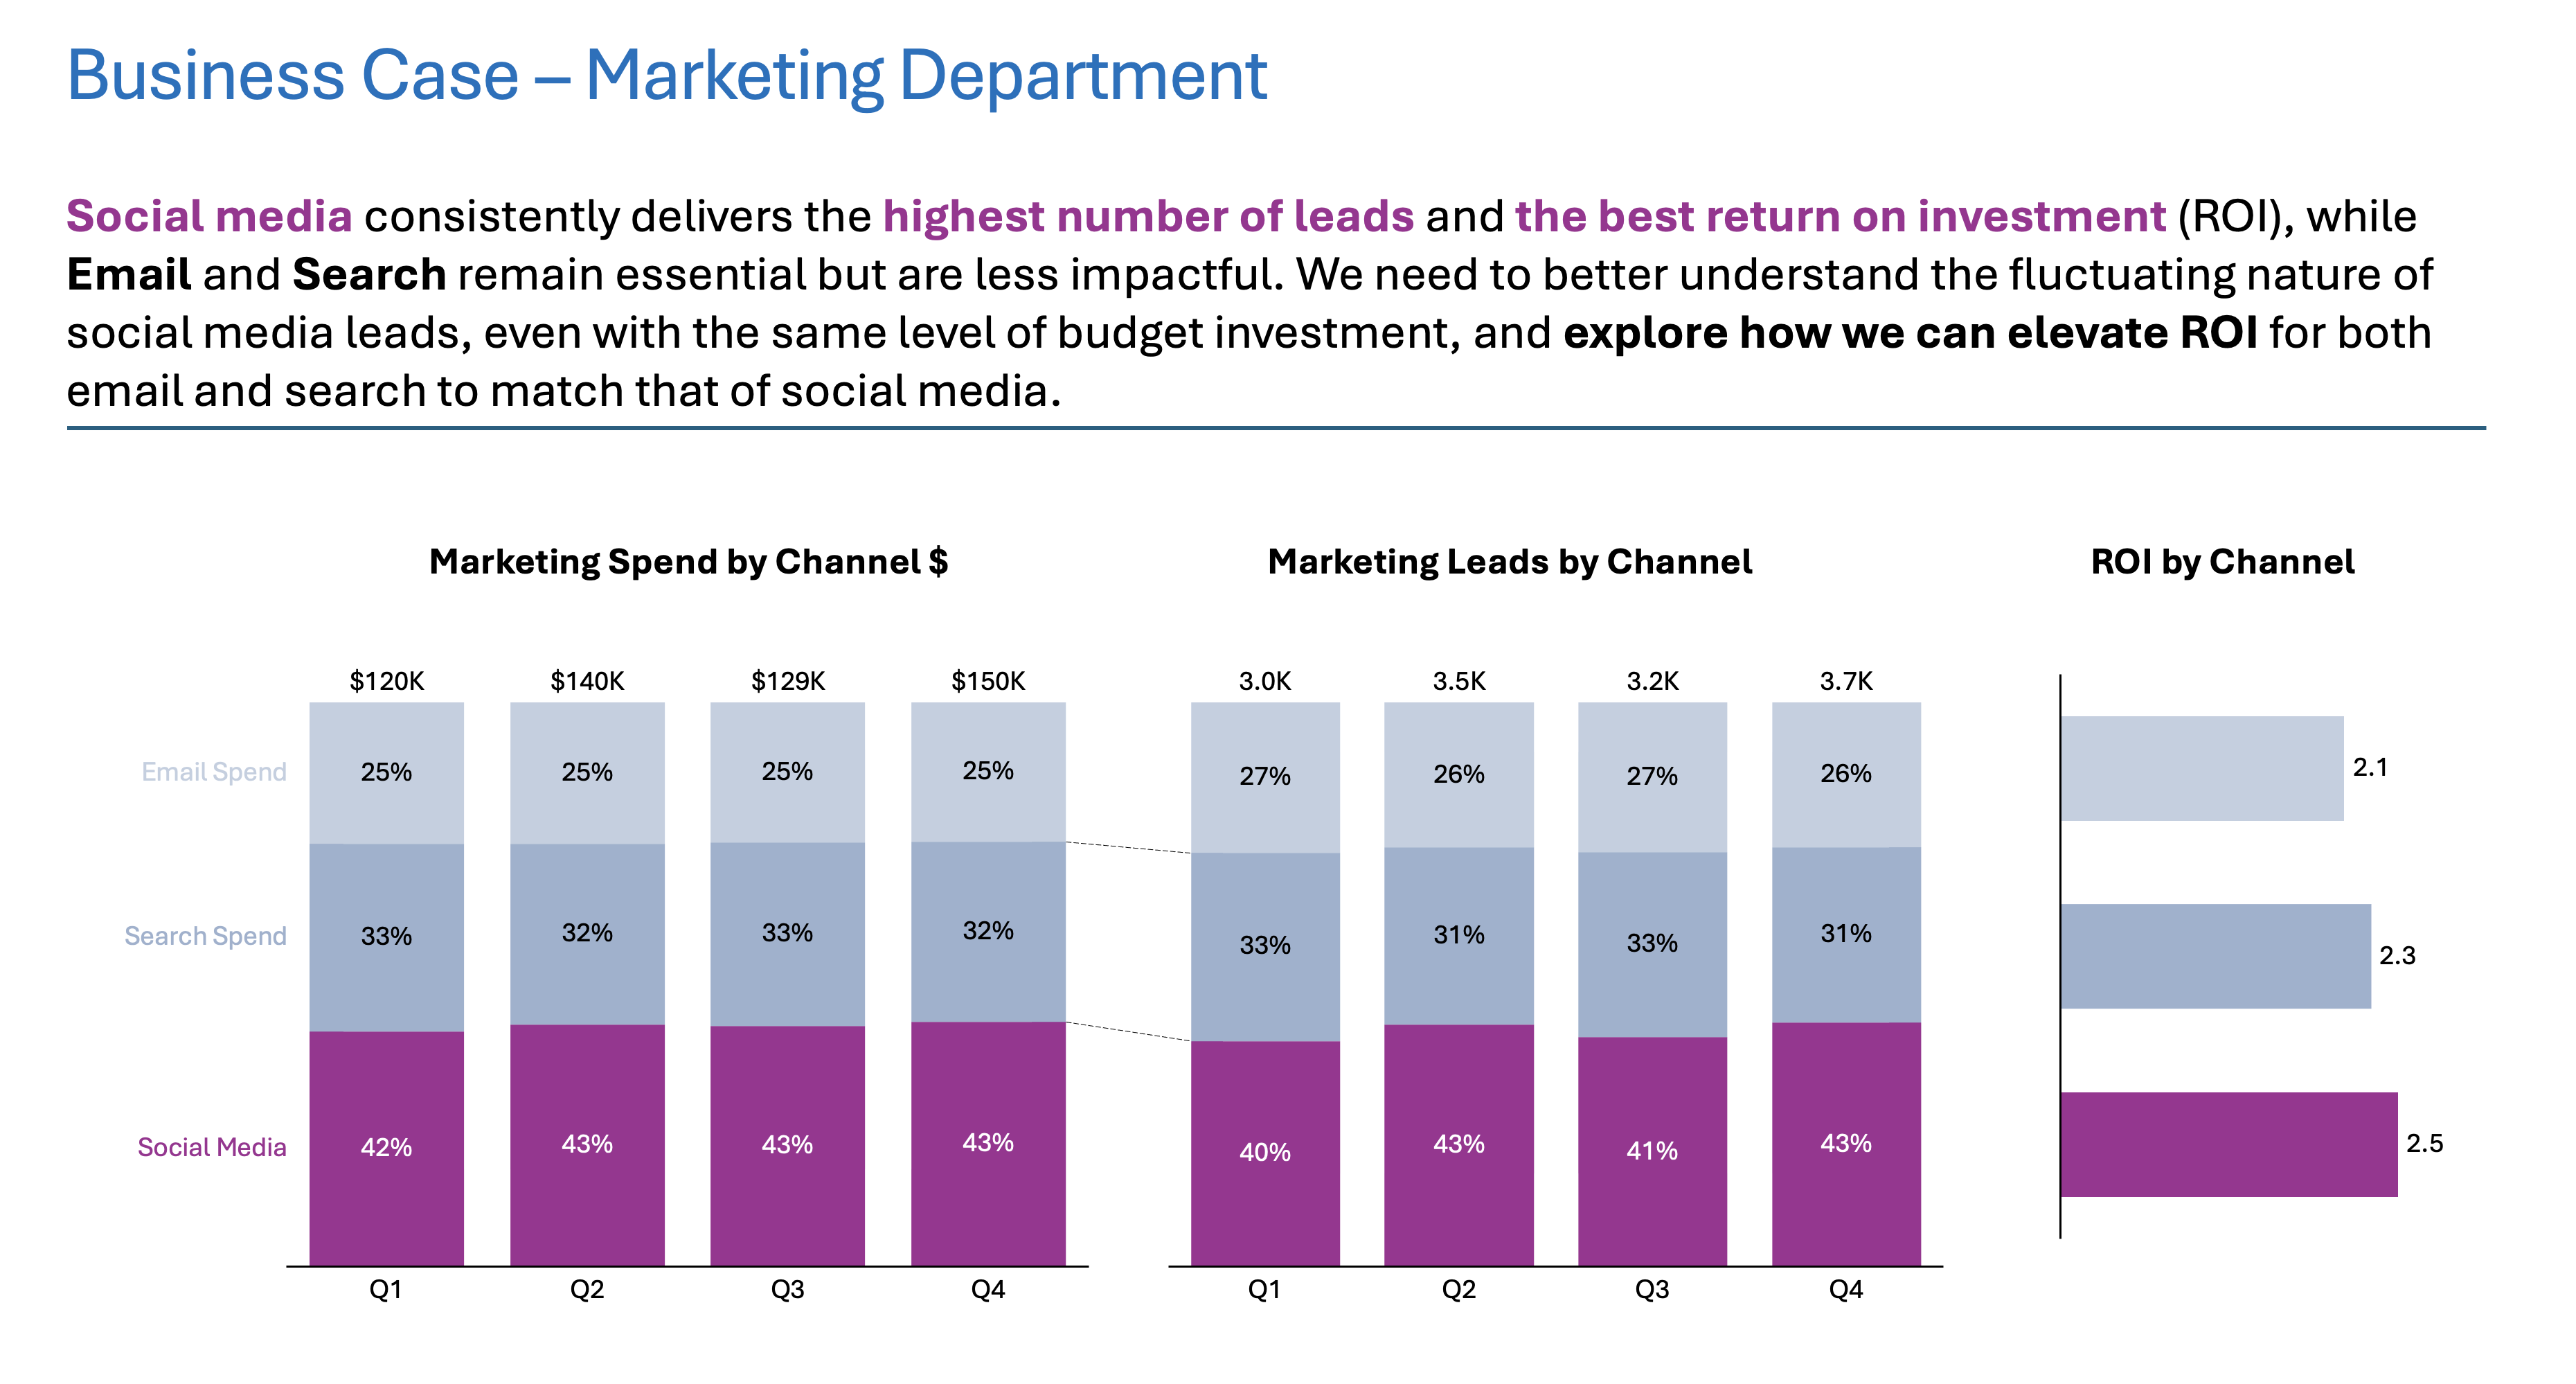
The Marketing Department needs help with Media Channel Strategy and ROI

Situation
The Marketing Department of a mid-sized company manages quarterly digital marketing campaigns. They focus on three main channels: Social Media, Email, and Search. Each quarter, the team allocates a budget, executes campaigns, and tracks key performance metrics like spend, leads, and ROI. The leadership team expects a clear, data-driven review of campaign performance to guide future investment decisions.
Complication
Despite steady investments and ongoing campaigns, the Marketing Department struggles to communicate the true effectiveness and efficiency of each channel. Reports are often dense with numbers. This makes it difficult for leadership to quickly see which channels are delivering the best results. It is also hard to find where overspending may occur and how performance trends over time. This lack of clarity leads to uncertainty in budget allocation and missed opportunities for improvement.
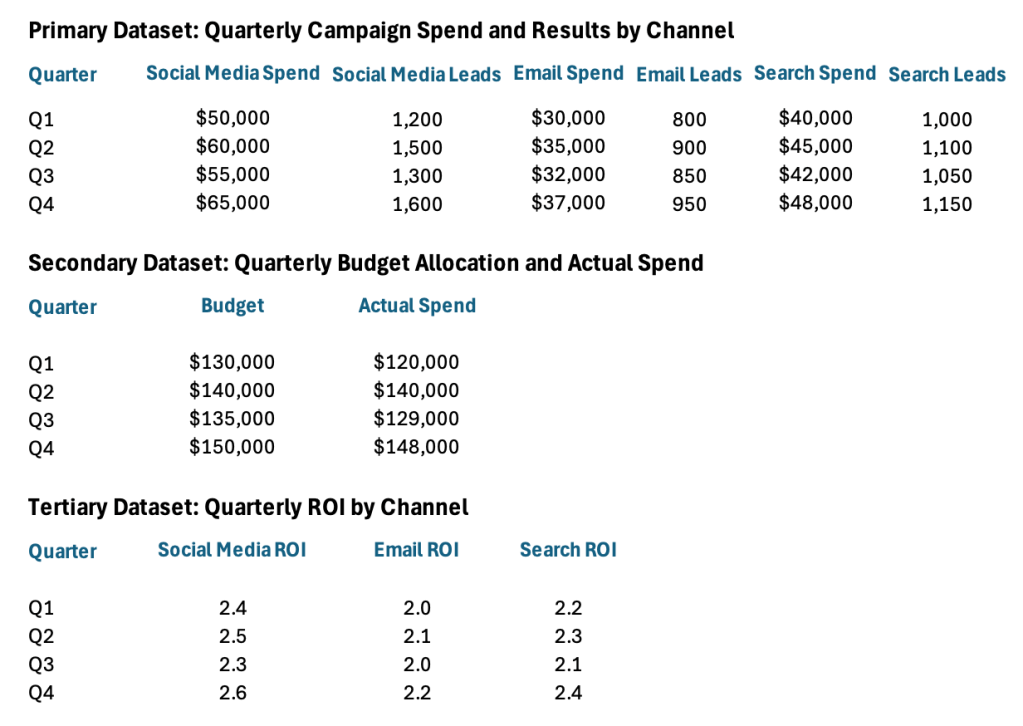
Data Set
What Chart to use?
Whenever we have words like “compare” or “composition” in the message, it usually indicates an Component Comparison. Hence, I would suggest the following approach to compare Marketing Channel Spend, Leads and ROI across the quarters.
And here it comes:
Resolution
Social media consistently delivers the highest number of leads. It also provides the best return on investment (ROI). Email and Search remain essential but are less impactful. We need to better understand the fluctuating nature of social media leads. This occurs even with the same level of budget investment. We should explore how to elevate ROI for both email and search. Our goal is to match the ROI of social media.
Summary
I hope this example provides you with some more straightforward guidelines on Component Comparison from day-to-day life. I did not explain all the small tricks on purpose. That explanation will probably come later on. For now, the important thing was to give you a simple walkthrough from task to outcome.
For a free downloadable resource, click the Chart Decision Tree and Compare Visual Guide.

Leave a comment