
Introduction
You’re not alone. This is true. You’ve found yourself staring at a mountain of spreadsheets, colorful charts, or a dashboard packed with metrics. Many people wonder, “So what does any of this mean?” This moment of uncertainty lies at the heart of Gilbert’s Law. It is an almost timeless principle. It’s rarely discussed but deeply relevant to anyone who works with data.
Simple, right? But its implications are significant. This is especially true in the world of data storytelling. The journey from raw numbers to actionable insight depends almost entirely on how the story is shaped, shared, and understood. Let’s explore why Gilbert’s Law can change your perspective on data. It can also alter how you present it to the world. But first, where does it come from?
Origins of Gilbert’s Law
“The biggest problem with a job is that no one tells you what to do.“
(Gilbert Lafayette Law)
Gilbert’s Law originates from Gilbert Lafayette Laws (1838–1907), an American politician, newspaper publisher, and businessman. Laws served as the Nebraska Secretary of State and as a member of the U.S. House of Representatives in the late 19th century.
This observation came from Laws’ experience in public service and business. He noted that many roles—despite having formal job descriptions—rarely provide clear guidance. They often lack actionable advice for performing the work or addressing unique challenges. Instead, employees must rely on self-direction, personal initiative, and problem-solving skills to succeed.
Why Gilbert’s Law Matters in Data Storytelling, too!
Let’s break down Gilbert’s Law: It’s all about taking initiative. When it comes to data, you have to explain what the numbers mean. You need to determine the next step. It’s essential to understand why it matters at all. In a world drowning in data, the actual value lies in how you interpret, contextualize, and share what matters most.
Imagine presenting a graph that shows sales data increasing month by month. To you, as the analyst, it’s all in a day’s work. But for your audience—be it the CEO, the marketing team, or your client—those bars and lines are just shapes. They need someone to interpret them. Gilbert’s Law in action means not waiting for someone else to connect the dots; you do it.
Data Storytelling: Taking Control of the Narrative
“Don’t wait for someone to ask: What does it mean?”
Data storytelling isn’t just about showing facts. It involves crafting a compelling narrative. This narrative makes those facts meaningful to your audience. Here’s where Gilbert’s Law really shines:
- Don’t wait for someone to ask, “What does this mean?” Instead, proactively lead your audience through the story, uncover insights, and propose possible actions.
- Be the guide, not just the reporter. It’s easy to dump dashboards onto people. However, the magic happens when you translate those dashboards into stories. These stories reveal opportunities, risks, and growth.
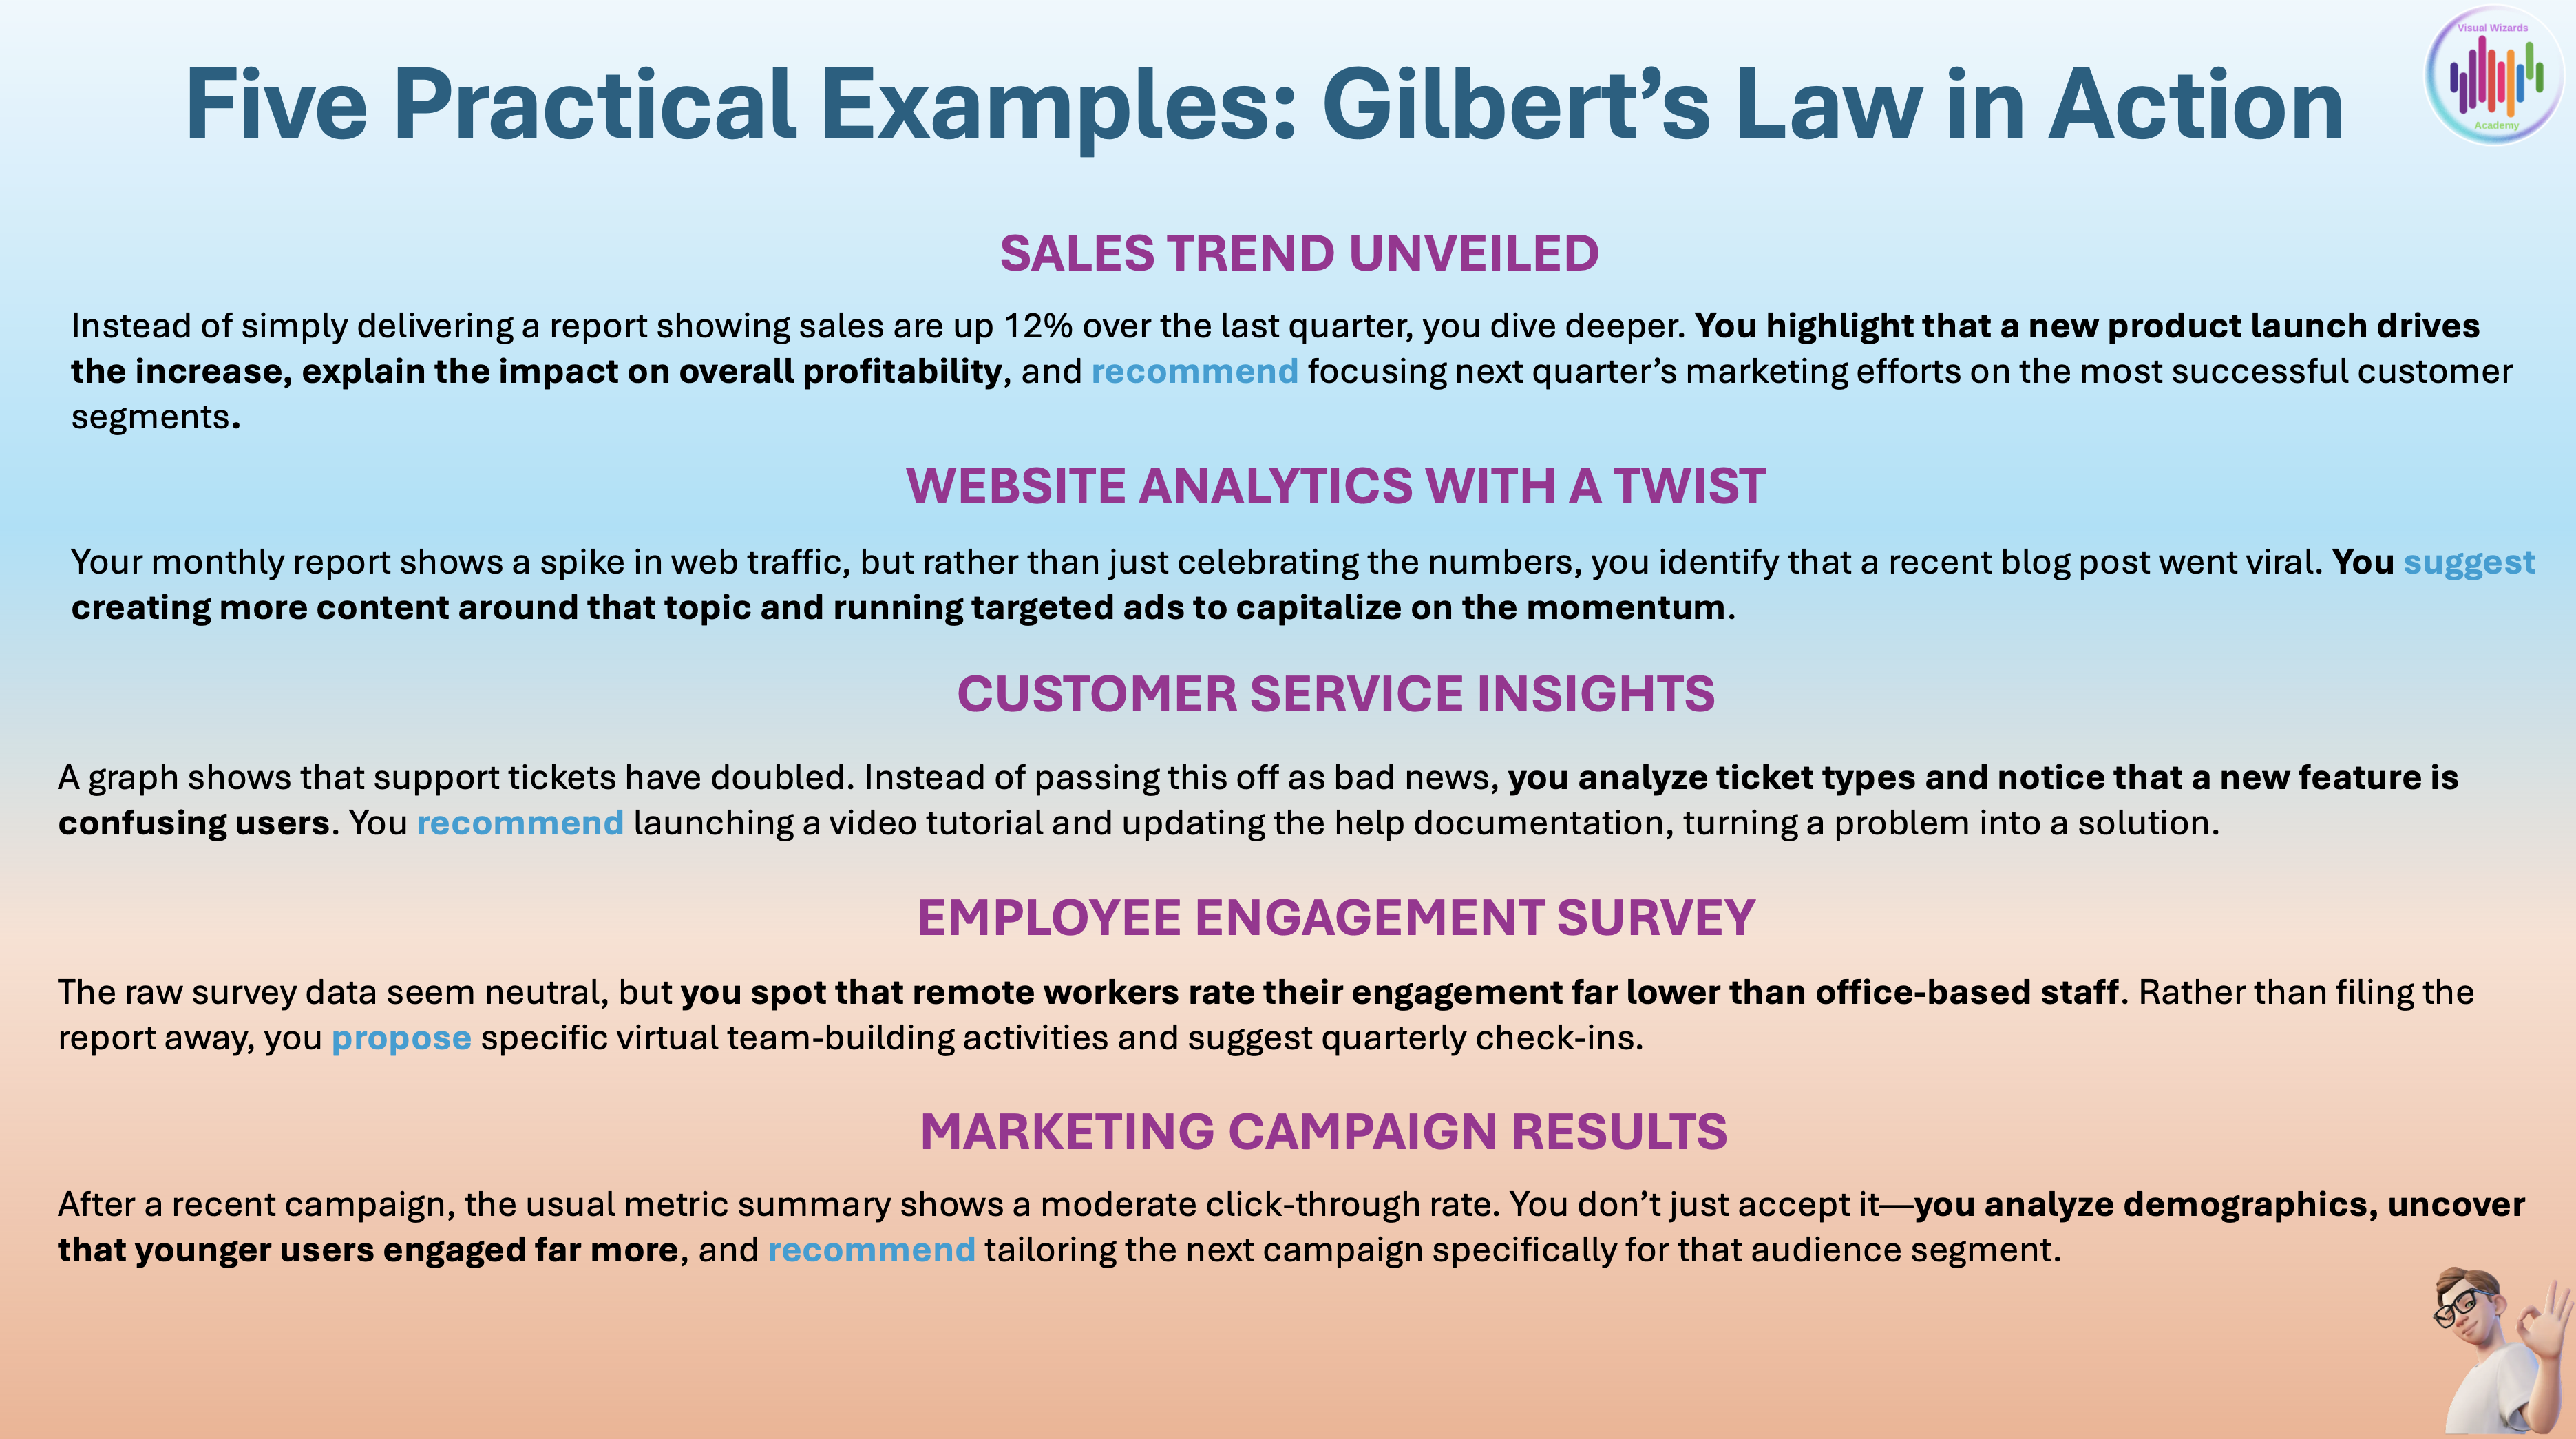
Application in Data Storytelling: Practice over Theory
Let’s make this principle practical. Here are five everyday scenarios where Gilbert’s Law transforms data storytelling from passive reporting to real leadership. Read below and notice the blue-highlighted words. That’s where the power is.
Shaping Your Data Stories with Gilbert’s Law
What’s the common thread? In each case, the data storyteller steps up, interprets, recommends, and leads—just as Gilbert’s Law advises. Without this proactive approach, data remains disconnected, and the audience is left guessing.
How do you apply this in practice?
- Start every data project with the audience in mind. What do they care about? What decisions might they face?
- Don’t assume the implications are obvious. Guide your audience, underline the “why,” and spell out the “what next.”
- Make room for questions, invite dialogue, and encourage others to share what the data means to them.
Summary
In today’s world, there’s so much information that Gilbert’s Law is more than just a funny saying. It’s a call to tell stories carefully. It’s also a way to be a leader. So, the next time you make a report, give a presentation, or create a dashboard, remember this. It’s up to you to understand what it means. No one else will tell you. That is your job and your opportunity to excel.
Your data, your story. Take charge, make it meaningful, and help your audience move from confusion to clarity, and from insight to action. That’s the true power of Data Storytelling, and the lasting legacy of Gilbert’s Law.
For a free downloadable resource, click the Chart Decision Tree and Compare Visual Guide.

Leave a comment