
This is the 4th part of our Big Context storyline when creating your narrative about Business Performance.
Last few articles we have gone through Internal Performance and Internal Relative Performance. Now, we are going to add External Relative Performance.
External, means outside of your company. Usually it means to compare vs. your competitors or Industry or specific part of the Market (PAM/TAM/SAM/SOM – we can talk about this later). If there is an official agency that monitors market performance, consider taking something recognized by your competition. For the Technology sector, there are few of them such as: IDC, Gartner, Catalyst, NIQ/GFK, Circana..etc.
When comparing it to your market, you generally use Unit or Revenue Growth or Market Share. With the Growth, you either achieve Growth Premium to Market or you are in a Growth Gap to Market. If you are in growth Premium to Market, you should also be growing your Market Share. Market Share = Your Revenue vs. Total Market Revenue.
If you want to compare to a specific competitor, you can reach out to their Investors Relation websites. Use their official Financials to compare many more metrics than just Growth and Share. But beware that many times the business models and company structures prohibit accurate comparisons, rather focus on directional compare.
Now, going back to our example and wrapping up our Storyline of Product X and its Performance for past quarter(s).
Start/Entry
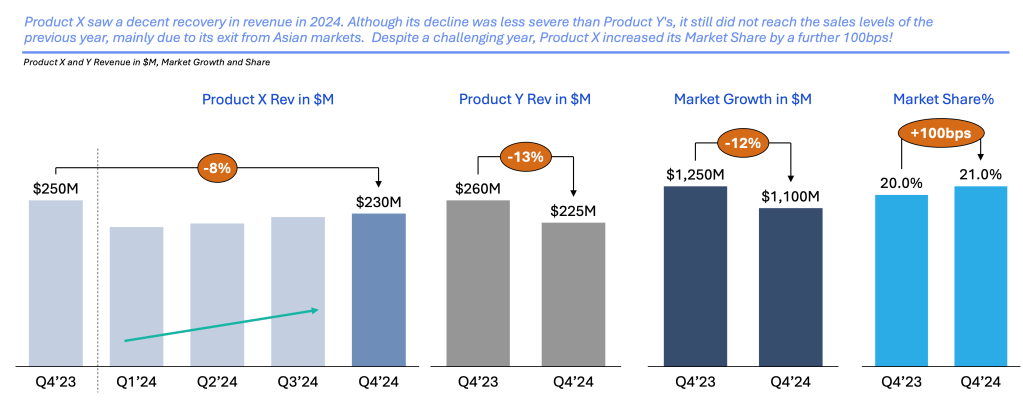
Product X Revenue is down 8% on Y/Y basis, while the expectation was a growing business.
Plot – Big Picture
However, there are few points to call out before we zoom in on just Y/Y basis:
- Product X has improved its volumes over the past 3 quarters after the significant fall at the beginning of the year resulting from the Asian Market exit
- Product X’s decline was less vs. its close comparison of Product Y, and Product Y is sold in every geography, including Asia
- While the expectation for Product X was to grow its Revenue Y/Y, so was the expectation for the overall Market, which did not happen
- The market has declined 12% Y/Y, which created a Growth Premium for our Product X, resulting in a Market Share gain of 100bps
Conclusion
Not always the story looks as bad as we originally think. We need to step back and look at the specific performance in a larger context, the Big Picture. This helps us further understand the overall story. It also builds valuable insights. Additionally, it helps your business partners navigate the overall dynamics of the product, company, competitors, and the market.

Leave a comment