
The Basics of Data Storytelling
Let’s continue with Step 2 – Identify the points you want to emphasize from your data. The Data Storytelling is everywhere!. There are so many charts swirling around us, but many of them can be simply bucketed into 5 categories:
- COMPONENT COMPARE
- ITEM COMPARE
- TIME SERIES COMPARE
- FREQUENCY (DISTRIBUTION) COMPARE
- CORRELATION COMPARE
The Day-to-Day Life Examples
Let’s continue with the last and 5th one – CORRELATION COMPARE.
To easily illustrate from day-to-day life what it looks like, here are the next examples:
POSITIVE CORRELATION


HEIGHT AND WEIGHT
Generally, taller individuals weigh more. As height increases, weight tends to increase as well. This is due to the greater volume of muscle and bone that typically accompanies increased height.
TEMPERATURE AND ICE CREAM
On hotter days, ice cream sales typically rise. As the temperature goes up, so do ice cream sales. Thus, many ice cream vendors prepare for this seasonal increase by stocking up on popular flavors. On hotter days, ice cream sales typically rise. As the temperature goes up, so do ice cream sales.
MONEY SAVED AND FINANCIAL SECURITY
As people save more money, they feel more financially secure. This increased sense of security often encourages them to make bolder financial decisions, for example, investing or purchasing a home.
NEGATIVE CORRELATION


RUNNING AND BODY FAT
The more time someone spends running, the lower their body fat tends to be. This correlation suggests that regular running can contribute significantly to weight loss and overall better health. Additionally, integrating running into a daily routine can improve cardiovascular endurance, leading to a more active lifestyle.
TIME SPENT PLAYING VIDEO GAMES AND EXAM SCORES
If a student spends more time playing video games than studying, their exam scores will not be excellent. Thus, students must find a balance between leisure activities and academic responsibilities. This balance is essential for achieving optimal results.
UNEMPLOYMENT RATE AND CONSUMER SPENDING
When the unemployment rate rises, consumers often spend less. This decrease in consumer spending can lead to further economic decline, creating a challenging cycle for recovery..
EXTRA CORRELATION EXAMPLES:
- Rainfall and Crop Yields: More rainfall often leads to better crop yields. This shows a positive correlation between weather and agricultural productivity.
- Internet Usage and Social Media Engagement: As internet access increases, more people use social media. This trend reflects a positive correlation.
- Sleep and Productivity: More sleep is linked to better productivity at work or school.
- Snowfall and Snow Shovel Sales: As snowfall increases, so do sales of snow shovels.
THE SUMMARY OF THE DAILY EXAMPLES
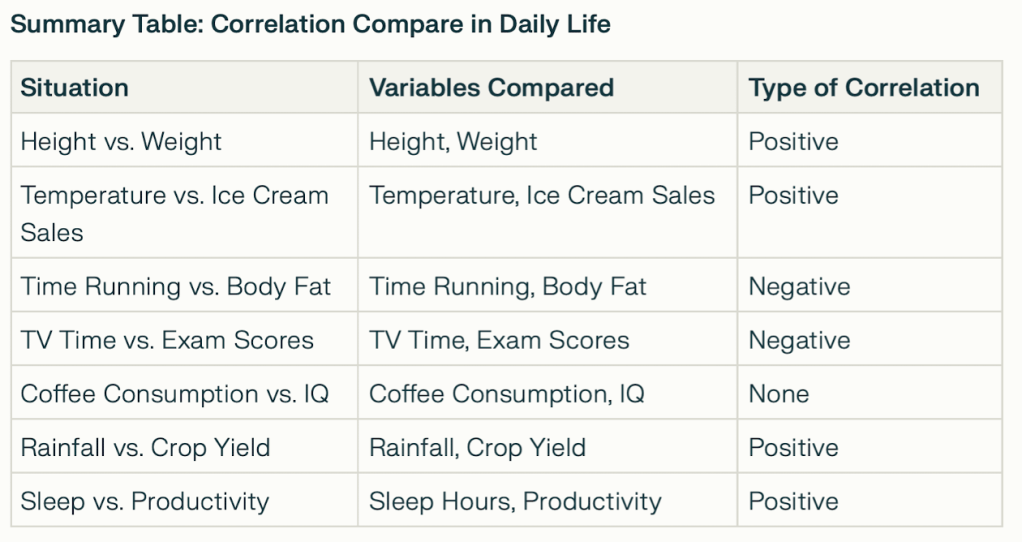
Conclusion
Anytime your story uses words like relationship, increases with, contrary to, follows, opposite, etc., you can almost be sure that you will use charts in the CORRELATION COMPARE section.

Leave a comment