

From Practice to Theory
Recently I was thinking, I have written quite a lot around theory on how to approach Data Storytelling and Visualisation, but I did not give too much to practicing what we learnt so far.
Yes, I have built a simple course for the beginners and it generated a great amount of traffic and attention, but it was just one training.
My Course for beginners: The Curious Beginner.

In this training you will go through 10 steps that are pretty straightforward and reference in many of my articles.

You don’t need much – just a little bit of patience and willingness to try something new.
I strongly recommend that you take a look at the whole training. No prerequisites are required, just a little bit of time and your willingness to change your career.
“Would this be a One Day or Day One for you?”
Something new
I was thinking about something else as well. Everyone is under pressure for time and people sometimes do not have even 15 min to offer, but maybe they do have 1 min.
Yes, I have created mini cases which you can learn from, use at your teams, or within your own companies to test your analyst, data specialist, FP&A or generally Finance people to understand what a good chart and storytelling looks like.
The Structure will be like this:
- The case story split into the: Situation, Complication and what the CEO/CFO wants from you
- Around 30 seconds to read
- The Numbers behind the story
- Around 30 seconds read
- Working Space
- Space where you make your own workings and suggestion, sketches
The document will have another page with the proposed solution (definitely not the only alternative).
All the numbers, case details and names are completely made up.
It will look like this – Business Case 1 – Kestrel Cloud:

You should apply all the frameworks I explained to you in previous articles, but you can use my downloadables too.
Top 30 Data Storytelling Tips : Link
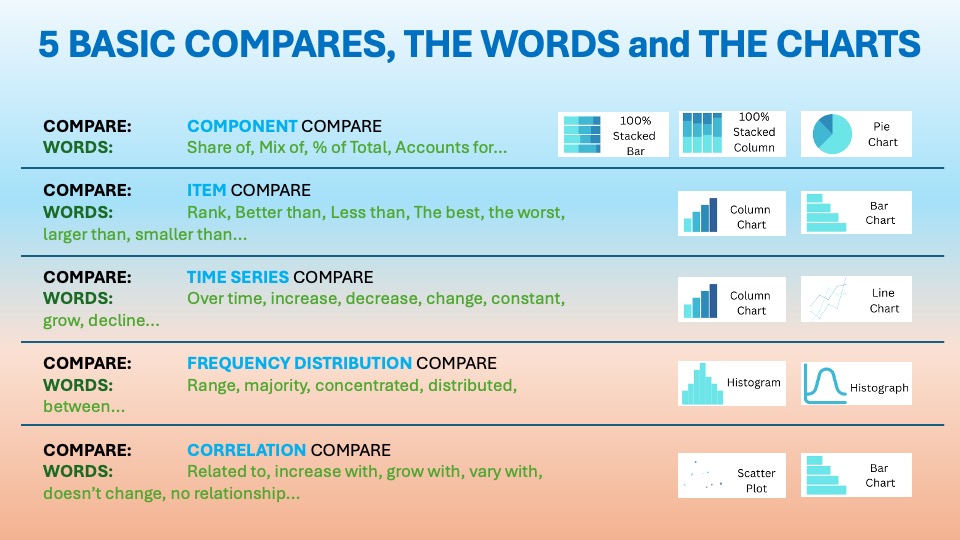
5 Basic Chart Compares: Link
Tree Chart Selection: Link
Tufte’s Data Ink Ratio: Link
It’s not a rocket science – just practicing enough to make it part of your DNA.
The solution can look like this:

Just keep it simple and playful – I have created 10 Business cases with different charts and stories. Pls do explore and give me feedback, in the same way as you did for The Curious Beginner Course.
You can find the link to the 10 Short Cases here: Link
Summary – From insights to action
The fastest way to sharpen your data storytelling is to practice on short, realistic business cases. Each case gives you a focused problem, a small set of charts and numbers, and a clear opportunity to turn analysis into a message leaders can act on.
Working through these cases helps you build the habits that make a difference: choosing one clear point, simplifying the visual, and using charts to guide attention rather than display everything at once. You learn by trying, comparing, and refining, not by memorizing more rules.
The feedback loop is where the real progress happens. Create your version, test whether the story is easy to understand, then use the critique to make the next slide clearer, more focused, and more useful. Ten short cases give you a practical way to make that improvement part of your everyday work.
Ready to put your skills into practice? Explore the 10 short business cases, try the free Curious Beginner training, and subscribe below for ongoing data storytelling insights and practical ideas.
Leave a Reply